Last week : Strong earnings from CoreWeave ; soft US July CPI/PPI ; Oil higher (WTI +5%); Nikkei +4.5% as JPY weakening
WEEKLY TRENDS
WEEKLY TRENDS
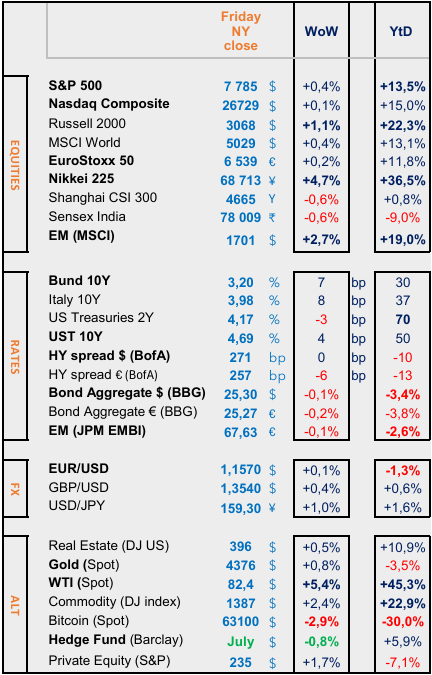
- Last week, strong Q2 earnings and outlook from CoreWeave (+60% Ebitda margin, $104bn revenue backlog) boosted US stocks but it was the US SME index, Russell 2000, which benefitted the most (+1%).
- The US inflation (CPI and PPI for July) showed weaker figures (CPI at +3.4% vs 3.5% in June and same for PPI at +4.7% vs 5.5% prior). As a consequence, the US Curve steepened (+7bps) with the 2yr Yield lower (-3bps) and the 10 yr higher (+4bps). Odds for a FED hike mid Sep has come down to 25% from 75% a few weeks ago. Note that the 30yr UST auction showed last week the highest yield since 2001.
- The Nikkei performed well (+4.5%) while the JPY weakened (-1%) vs the USD. Oil rose (WTI at +5%) as uncertainty remains over the Hormuz Strait accord. The BTC underperformed at -3% just above the $63k level. Next week we shall have releases from another chip manufacturer (Analog Devices) and large consumers firms (Home depot and Walmart) while in China we will have the figures from Alibaba and Zijin Mining. Not much important macro data to be released before early September now (US NFP and FED/ECB/BOE/BOJ meetings).
MARKETS
Equities
Q2 earnings weekly performances :
Earnings weekly performances : CoreWeave (+14%) Cisco (-9%) Applied Mat. (-8%) Tencent (-8%)
NB : Reddit (+12% on stock set to join SP500 on August 18)
Bank analysts : Amundi (UBS ‘buy’ target €105) ArcelorMitttal (MS ‘o/w’ target €70) Nexans (JPM ‘o/w’ target €183, Barclays’ target is at €179) Roche (MS ‘o/w’ target ₣410)
M&A : EasyJet finally bought by Apollo for £5.7bn
Rates
US curve steepening (2-10 years) higher at +52ps (+7bps)
HY corp. spreads lower : US at +271bps (0bp) EU at +257bps (-6bps)
Commodities
Oil price WTI higher (+5.5%) NB US strategic reserves (SPR) at 298m barrels, at operational floor level (first time below 300m since 1983)
Gold price higher (+1%) on lower 2yr UST yield
US
July CPI (+3.4% as exp. vs +3.5% prior, Core at +2.5% vs +2.6% prior)
July PPI (+4.7% vs +5.5% prior), Core at +4.2%
Crypto
BTC (-3%) after +3% the previous week
Under the watch
Mag7 Buybacks (since 2021 Buybacks from those firms represented on average +$150bn p.a., in 2026 so far the number is negative at -$147bn)
Nota Bene
Anthropic Q2 revenue surged 14x YoY to $11.5bn (IPO due in Sep/Oct)
SP500 earnings (90% of SP500 companies have now reported their Q2 earnings, sales are up 15% over last year’s, the highest rate since 2021)
Berkshire Hathaway (first equity purchase after 3 year selling) Alphabet
Hyperscalers AI Capex at $735bn in 2026 (87% of US defense budget)
CALENDAR
Earnings releases : US Home Depot (18 August) Analog Devices (19) Walmart (20)
China Alibaba (20 August) Zijin Mining (21)
Upcoming CB meetings : ECB (10 Sep) FED (11) BOE (17) BOJ (18)
WHAT ANALYSTS SAY
Edmond de Rothschild, 13 August 2026
Authors : Stephane Mayor, Senior EM debt Fund Manager
In 2026, a year marked by geopolitical tensions in the Middle East, the movement in the price of a barrel of Brent crude has undoubtedly been one of the most influential indicators in the performance of emerging market corporate debt over recent months. The ‘Oil & Gas’ segment accounts for nearly 12% of the market index. It is the second-largest sub-index after ‘Financials’ (34%). It therefore exerts a significant influence on market movements and behaviour.
The price of Brent crude traded within a narrow range of around US$12, between US$59/bbl and US$71/bbl, between the end of July 2025 and the end of February 2026. During this period, we observed that oil-producing companies with a high ‘break-even price’ – their profitability threshold – above US$60/bbl were under relatively significant market pressure. Indeed, at these levels, a number of them were unable to generate sufficient ‘free cash flows’ – surplus cash – to service their debt. The risk was not short-term but rather over a two- to three-year horizon. Geographically, these companies are mainly located in Colombia, Nigeria and Ghana.
The situation has changed dramatically since the beginning of March with the resurgence of tensions in the Middle East, particularly the conflict between the United States and Iran. The oil market has been severely disrupted. As a reminder, around half of the oil exported from the Gulf region passes through the Strait of Hormuz, the epicentre of the conflict. That was all it took for crude oil prices to soar.
Consequently, the average price of Brent has stood at over US$94/bbl since the end of February, compared with US$65/bbl for the previous six months. For the group of companies mentioned above, the situation has changed completely since the beginning of March. With Brent at its current level, revenues have soared, boosted by the new crude oil prices. The recovery, already evident at the end of the first quarter, has been confirmed by the recent publication of second-quarter results. With the price of Brent at the end of July still at US$90 per barrel, it is likely that results will remain positive until the end of the year.
For the leading players in the Latin American market, price fluctuations are less of a determining factor in terms of earnings growth. Indeed, companies such as Petrobras in Brazil, Ecopetrol in Colombia and YPF in Argentina have production costs well below the market price. They are therefore more sensitive to their domestic environment (regulations, fiscal policy, political support, etc.) than to price fluctuations.
The example of Ecopetrol in Colombia is telling: the outcome of the recent presidential elections brought Abelardo Gabriel de la Espriella to power at the end of June. This hard-line right-wing politician is expected to revitalise the country’s oil and gas sector following a four-year freeze on all new exploration activities imposed by the outgoing president, Gustavo Petro. It is not only Colombia’s leading producer but the sector as a whole that is set to benefit from a broader scope for action.
The market was quick to adjust the pricing of bonds issued by the companies concerned. In some specific cases, double-digit increases have been observed, and in all cases the rises have exceeded the market average. Proof of this is that the ‘Oil and Gas’ index posted a 3.7% rise at the end of July, double that of the market index. It is the best-performing sector.
There is no doubt that an overweight position in this sector during the first quarter will have proved lucrative for investors exposed to emerging market corporate debt.
Wisdom Tree, 6 August 2026
Authors : Aneeka Gupta, Associate Director, Research
Few investment themes intersect as directly with the energy transition, national security and technological advances as strategic metals and rare earths. Copper and lithium are essential for powering electric vehicles and the electricity grid. At the same time, certain rare earths such as neodymium and dysprosium are used in the composition of permanent magnets that power electric vehicle (EV) motors and wind turbines. Furthermore, metals such as tin, silver, germanium and antimony now play a key role in defence systems and cutting-edge electronics. Demand for these materials is expected to grow for several decades. The real question facing the market is not about their importance, but rather about who controls them. For the time being, the answer is China, and this is no coincidence. Thirty years of a persistently pursued industrial policy have enabled China to build the most strategic position in critical raw materials of the modern era, centred on the processing and refining stages – the very stages that are the most difficult to replicate.
The July correction is cyclical; the thesis is structural. The standout development was a sharp reversal in rare earths. MP Materials, in the United States, fell by 26%; in Australia, Lynas dropped by 21%, whilst on the Chinese side, producers such as Shenghe Resources Holdings and Grinm Advanced Material Co saw their share prices plunge by 29 % and 47% respectively. China thus found itself at the bottom of the country allocation rankings, posting a decline of 13.7% and recording the most significant negative contribution. The United States followed closely behind, also penalised by the same players in the rare-earths sector. These losses were offset by gains from Indonesian nickel and tin producers (Vale Indonesia (+27%), Metals X Ltd (+21%), Pt Timah Tbk (+16%)) as well as by the rebound seen among South African mining companies. In terms of size, it was the medium-sized companies that suffered the most, with an 11% decline, whilst the major producers once again fared better.
This year, hedge funds have increased their short positions in several US companies in the critical minerals sector, including MP Materials, US Antimony and American Resources. In their view, even though Washington’s support remains substantial, it will take years to erode China’s influence, and this support alone may not be enough. Short positions in US Antimony, which accounted for around a quarter of its market capitalisation at the start of the year, now exceed 40%. As for American Resources, a company that generated no turnover last year, the proportion of short positions has risen from less than 10% to more than a fifth of its shares. This scepticism is based on two points :
Firstly, several of these companies saw their share prices triple in 2025 thanks to government equity investments, loans and purchase agreements, leading to valuations that critics believe are driven more by political announcements than by fundamentals.
Secondly, and on a more structural level, a report by SAFE’s Centre for Critical Minerals Strategy asserts that the main constraint facing the West is financial rather than geological. There is a shortfall in public funding, whilst mines and processing plants are highly capital-intensive and can take a decade or more to build; meanwhile, China retains the ability to adjust prices by flooding the market with supply as soon as competitors reach a certain scale. In our view, none of this undermines the structural thesis; on the contrary, it reinforces it. The argument in favour of a decline rests primarily on the concentration observed within a small number of speculative US stocks, which frequently lack revenue or are dependent on a single commodity.
Loomis Sayles, 13 August 2026
Authors : Elisabeth Colleran, co-Head EM Debts, Portfolio Manager
Emerging markets are now at the heart of two major investment trends: artificial intelligence and energy. Yet a common misconception persists: that the recent energy shock has undermined their resilience. This is precisely where the ‘lie’ lies. Historically, a sharp rise in energy prices has often weighed on emerging economies, particularly those heavily reliant on imports. But this time, their response has been swift. Governments have employed a range of measures, from subsidies and consumption-restriction measures to the diversification of oil supplies.
The exceptional surge in global investment in artificial intelligence is one of the factors underpinning this resilience. Moreover, certain seemingly negative signals should be interpreted with caution. In emerging Asia, the widening of trade deficits is notably linked to rising energy imports. However, it also reflects an increase in imports of capital goods and industrial intermediate goods, which are likely associated with the development of the infrastructure required for AI.
AI relies on extremely complex supply chains. A large proportion of these supply chains pass through emerging markets, particularly in Asia. They encompass IT components, data centre equipment, silicon wafers, electronic components and energy storage systems. China, South Korea, Taiwan, Vietnam, Malaysia and Singapore are key players in this sector. The strong demand for semiconductors is already reflected in the rise in technology exports from South Korea and Taiwan. The Philippines also plays a significant role in assembly and testing, whilst India is gradually developing its design and production capabilities within the AI ecosystem. This wave of investment is not limited to technology.
The rapid expansion of data centres and AI-related infrastructure is also driving a structural increase in demand for electricity. According to estimates from the International Energy Agency, global electricity demand is expected to grow by 3.6% per year between 2026 and 2030, compared with an average of 2.8% over the previous decade. This will require significant investment in the modernisation of electricity grids, storage and electricity transmission infrastructure. Several Asian countries are already among the world leaders in electrification and renewable technologies. China, in particular, dominates the production of solar and electrical equipment. China and South Korea play a key role in battery storage, whilst India is a major producer of wind turbines. By highlighting the need to secure supplies, it is prompting countries to invest more in their own generation capacity and reduce their reliance on imports. China is therefore undertaking a five-year programme to modernise its electricity grid, worth over $700bn.
Raw materials: another strategic pillar
Beyond semiconductors and electricity, the rise of AI also depends on a wide range of raw materials. EM play a vital role. Chile and Peru account for nearly a third of the world’s copper reserves. Indonesia is a major supplier of tin, nickel and copper, whilst China remains a key player in rare earths. In Africa, the Democratic Republic of the Congo dominates the cobalt market by a wide margin, with an estimated share of global production of around 70%. These resources represent a significant structural advantage for emerging economies. They enable these economies not only to benefit from rising global demand but also, in the long term, to move up the value chain by developing greater local processing and production capacity.
The true picture of EM is therefore less one of economies weakened by the energy crisis and more one of players playing an increasingly central role in the major investment cycles linked to AI, electrification and infrastructure.
Equities
Q2 earnings weekly performances :
Earnings weekly performances : CoreWeave (+14%) Cisco (-9%) Applied Mat. (-8%) Tencent (-8%)
NB : Reddit (+12% on stock set to join SP500 on August 18)
Bank analysts : Amundi (UBS ‘buy’ target €105) ArcelorMitttal (MS ‘o/w’ target €70) Nexans (JPM ‘o/w’ target €183, Barclays’ target is at €179) Roche (MS ‘o/w’ target ₣410)
M&A : EasyJet finally bought by Apollo for £5.7bn
Rates
US curve steepening (2-10 years) higher at +52ps (+7bps)
HY corp. spreads lower : US at +271bps (0bp) EU at +257bps (-6bps)
Commodities
Oil price WTI higher (+5.5%) NB US strategic reserves (SPR) at 298m barrels, at operational floor level (first time below 300m since 1983)
Gold price higher (+1%) on lower 2yr UST yield
US
July CPI (+3.4% as exp. vs +3.5% prior, Core at +2.5% vs +2.6% prior)
July PPI (+4.7% vs +5.5% prior), Core at +4.2%
Crypto
BTC (-3%) after +3% the previous week
Under the watch
Mag7 Buybacks (since 2021 Buybacks from those firms represented on average +$150bn p.a., in 2026 so far the number is negative at -$147bn)
Nota Bene
Anthropic Q2 revenue surged 14x YoY to $11.5bn (IPO due in Sep/Oct)
SP500 earnings (90% of SP500 companies have now reported their Q2 earnings, sales are up 15% over last year’s, the highest rate since 2021)
Berkshire Hathaway (first equity purchase after 3 year selling) Alphabet
Hyperscalers AI Capex at $735bn in 2026 (87% of US defense budget)
CALENDAR
Earnings releases : US Home Depot (18 August) Analog Devices (19) Walmart (20)
China Alibaba (20 August) Zijin Mining (21)
Upcoming CB meetings : ECB (10 Sep) FED (11) BOE (17) BOJ (18)
WHAT ANALYSTS SAY
Edmond de Rothschild, 13 August 2026
Authors : Stephane Mayor, Senior EM debt Fund Manager
In 2026, a year marked by geopolitical tensions in the Middle East, the movement in the price of a barrel of Brent crude has undoubtedly been one of the most influential indicators in the performance of emerging market corporate debt over recent months. The ‘Oil & Gas’ segment accounts for nearly 12% of the market index. It is the second-largest sub-index after ‘Financials’ (34%). It therefore exerts a significant influence on market movements and behaviour.
The price of Brent crude traded within a narrow range of around US$12, between US$59/bbl and US$71/bbl, between the end of July 2025 and the end of February 2026. During this period, we observed that oil-producing companies with a high ‘break-even price’ – their profitability threshold – above US$60/bbl were under relatively significant market pressure. Indeed, at these levels, a number of them were unable to generate sufficient ‘free cash flows’ – surplus cash – to service their debt. The risk was not short-term but rather over a two- to three-year horizon. Geographically, these companies are mainly located in Colombia, Nigeria and Ghana.
The situation has changed dramatically since the beginning of March with the resurgence of tensions in the Middle East, particularly the conflict between the United States and Iran. The oil market has been severely disrupted. As a reminder, around half of the oil exported from the Gulf region passes through the Strait of Hormuz, the epicentre of the conflict. That was all it took for crude oil prices to soar.
Consequently, the average price of Brent has stood at over US$94/bbl since the end of February, compared with US$65/bbl for the previous six months. For the group of companies mentioned above, the situation has changed completely since the beginning of March. With Brent at its current level, revenues have soared, boosted by the new crude oil prices. The recovery, already evident at the end of the first quarter, has been confirmed by the recent publication of second-quarter results. With the price of Brent at the end of July still at US$90 per barrel, it is likely that results will remain positive until the end of the year.
For the leading players in the Latin American market, price fluctuations are less of a determining factor in terms of earnings growth. Indeed, companies such as Petrobras in Brazil, Ecopetrol in Colombia and YPF in Argentina have production costs well below the market price. They are therefore more sensitive to their domestic environment (regulations, fiscal policy, political support, etc.) than to price fluctuations.
The example of Ecopetrol in Colombia is telling: the outcome of the recent presidential elections brought Abelardo Gabriel de la Espriella to power at the end of June. This hard-line right-wing politician is expected to revitalise the country’s oil and gas sector following a four-year freeze on all new exploration activities imposed by the outgoing president, Gustavo Petro. It is not only Colombia’s leading producer but the sector as a whole that is set to benefit from a broader scope for action.
The market was quick to adjust the pricing of bonds issued by the companies concerned. In some specific cases, double-digit increases have been observed, and in all cases the rises have exceeded the market average. Proof of this is that the ‘Oil and Gas’ index posted a 3.7% rise at the end of July, double that of the market index. It is the best-performing sector.
There is no doubt that an overweight position in this sector during the first quarter will have proved lucrative for investors exposed to emerging market corporate debt.
Wisdom Tree, 6 August 2026
Authors : Aneeka Gupta, Associate Director, Research
Few investment themes intersect as directly with the energy transition, national security and technological advances as strategic metals and rare earths. Copper and lithium are essential for powering electric vehicles and the electricity grid. At the same time, certain rare earths such as neodymium and dysprosium are used in the composition of permanent magnets that power electric vehicle (EV) motors and wind turbines. Furthermore, metals such as tin, silver, germanium and antimony now play a key role in defence systems and cutting-edge electronics. Demand for these materials is expected to grow for several decades. The real question facing the market is not about their importance, but rather about who controls them. For the time being, the answer is China, and this is no coincidence. Thirty years of a persistently pursued industrial policy have enabled China to build the most strategic position in critical raw materials of the modern era, centred on the processing and refining stages – the very stages that are the most difficult to replicate.
The July correction is cyclical; the thesis is structural. The standout development was a sharp reversal in rare earths. MP Materials, in the United States, fell by 26%; in Australia, Lynas dropped by 21%, whilst on the Chinese side, producers such as Shenghe Resources Holdings and Grinm Advanced Material Co saw their share prices plunge by 29 % and 47% respectively. China thus found itself at the bottom of the country allocation rankings, posting a decline of 13.7% and recording the most significant negative contribution. The United States followed closely behind, also penalised by the same players in the rare-earths sector. These losses were offset by gains from Indonesian nickel and tin producers (Vale Indonesia (+27%), Metals X Ltd (+21%), Pt Timah Tbk (+16%)) as well as by the rebound seen among South African mining companies. In terms of size, it was the medium-sized companies that suffered the most, with an 11% decline, whilst the major producers once again fared better.
This year, hedge funds have increased their short positions in several US companies in the critical minerals sector, including MP Materials, US Antimony and American Resources. In their view, even though Washington’s support remains substantial, it will take years to erode China’s influence, and this support alone may not be enough. Short positions in US Antimony, which accounted for around a quarter of its market capitalisation at the start of the year, now exceed 40%. As for American Resources, a company that generated no turnover last year, the proportion of short positions has risen from less than 10% to more than a fifth of its shares. This scepticism is based on two points :
Firstly, several of these companies saw their share prices triple in 2025 thanks to government equity investments, loans and purchase agreements, leading to valuations that critics believe are driven more by political announcements than by fundamentals.
Secondly, and on a more structural level, a report by SAFE’s Centre for Critical Minerals Strategy asserts that the main constraint facing the West is financial rather than geological. There is a shortfall in public funding, whilst mines and processing plants are highly capital-intensive and can take a decade or more to build; meanwhile, China retains the ability to adjust prices by flooding the market with supply as soon as competitors reach a certain scale. In our view, none of this undermines the structural thesis; on the contrary, it reinforces it. The argument in favour of a decline rests primarily on the concentration observed within a small number of speculative US stocks, which frequently lack revenue or are dependent on a single commodity.
Loomis Sayles, 13 August 2026
Authors : Elisabeth Colleran, co-Head EM Debts, Portfolio Manager
Emerging markets are now at the heart of two major investment trends: artificial intelligence and energy. Yet a common misconception persists: that the recent energy shock has undermined their resilience. This is precisely where the ‘lie’ lies. Historically, a sharp rise in energy prices has often weighed on emerging economies, particularly those heavily reliant on imports. But this time, their response has been swift. Governments have employed a range of measures, from subsidies and consumption-restriction measures to the diversification of oil supplies.
The exceptional surge in global investment in artificial intelligence is one of the factors underpinning this resilience. Moreover, certain seemingly negative signals should be interpreted with caution. In emerging Asia, the widening of trade deficits is notably linked to rising energy imports. However, it also reflects an increase in imports of capital goods and industrial intermediate goods, which are likely associated with the development of the infrastructure required for AI.
AI relies on extremely complex supply chains. A large proportion of these supply chains pass through emerging markets, particularly in Asia. They encompass IT components, data centre equipment, silicon wafers, electronic components and energy storage systems. China, South Korea, Taiwan, Vietnam, Malaysia and Singapore are key players in this sector. The strong demand for semiconductors is already reflected in the rise in technology exports from South Korea and Taiwan. The Philippines also plays a significant role in assembly and testing, whilst India is gradually developing its design and production capabilities within the AI ecosystem. This wave of investment is not limited to technology.
The rapid expansion of data centres and AI-related infrastructure is also driving a structural increase in demand for electricity. According to estimates from the International Energy Agency, global electricity demand is expected to grow by 3.6% per year between 2026 and 2030, compared with an average of 2.8% over the previous decade. This will require significant investment in the modernisation of electricity grids, storage and electricity transmission infrastructure. Several Asian countries are already among the world leaders in electrification and renewable technologies. China, in particular, dominates the production of solar and electrical equipment. China and South Korea play a key role in battery storage, whilst India is a major producer of wind turbines. By highlighting the need to secure supplies, it is prompting countries to invest more in their own generation capacity and reduce their reliance on imports. China is therefore undertaking a five-year programme to modernise its electricity grid, worth over $700bn.
Raw materials: another strategic pillar
Beyond semiconductors and electricity, the rise of AI also depends on a wide range of raw materials. EM play a vital role. Chile and Peru account for nearly a third of the world’s copper reserves. Indonesia is a major supplier of tin, nickel and copper, whilst China remains a key player in rare earths. In Africa, the Democratic Republic of the Congo dominates the cobalt market by a wide margin, with an estimated share of global production of around 70%. These resources represent a significant structural advantage for emerging economies. They enable these economies not only to benefit from rising global demand but also, in the long term, to move up the value chain by developing greater local processing and production capacity.
The true picture of EM is therefore less one of economies weakened by the energy crisis and more one of players playing an increasingly central role in the major investment cycles linked to AI, electrification and infrastructure.
Contacts
8 Kievyan Street, Yerevan, Armenia
+374 10 712 259
+374 43 004 182
unibankinvest@unibank.am
Disclaimer
The information presented in the document contains a general overview of the products and services offered by Unibank OJSC (registered trademark – Unibank Invest, hereinafter referred to as the Bank).
The information is intended solely for the attention of the persons to whom it is addressed. Further dissemination of this information is allowed only with the prior consent of the Bank.
The information is only indicative, is not exhaustive and is provided solely for discussion purposes. The information should not be regarded as a public offer, request or invitation to purchase or sell any securities, financial instruments or services. The Bank reserves the right to make a final decision on the provision of these products and/or services to a specific customer, including refusing to provide products and/or services if such activities would be contrary to applicable law.
No guarantees in direct or indirect form, including those stipulated by law, are provided in connection with the specified information and materials. The information presented above cannot be considered as a recommendation for investing funds, as well as guarantees or promises of future profitability of investments.