
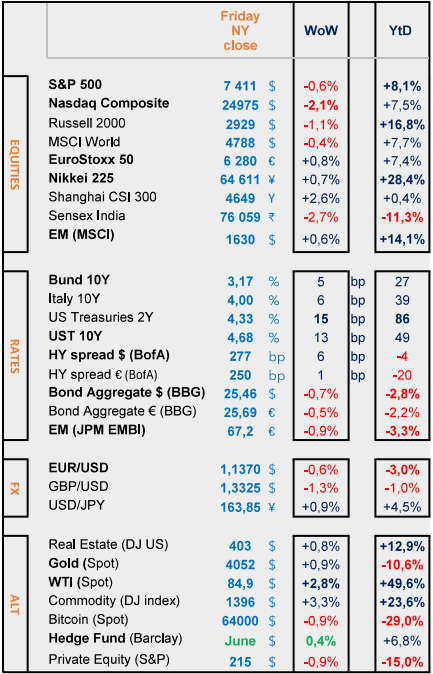
Last week : WTI +3% pushing UST yields up +15bps and bringing Nasdaq down -2% (Alphabet, Tesla off on higher Capex)
WEEKLY TRENDS
WEEKLY TRENDS
- Oil prices spike (+3%) revived inflation fears, pushing yields higher (UST yields +15bps). Q2 earnings (Alphabet -1% and Tesla -19% WoW) sold off on elevated Capex and softer cash flows (Alphabet reported negative free cash flow for the first time, and look for $200bn AI spending in 2026), reinforcing unease about big tech’s AI spending. Intel ended the week at -5% while Roche and Novartis finished the week at +7% and +3% respectively.
- Energy was without any surprise, the best performing sector last week while Discretionary being the worst. The ECB kept its rates on hold but left the door open for future tightening. Meanwhile Trump threatened up to 60 countries with new tariffs last week (including Canada with a 50% tax). Investors will continue to focus on Q2 earnings publications next week, with heavy weight companies like Microsoft, Meta, Apple and Amazon releasing theirs.
- Also of important note, the FOMC/FED meeting on Wednesday (no change expected there) with the second speech of new FED chairman Kevin Warsh who will have in his hands without a doubt, the latest June PCE data to be released on Thursday.
MARKETS
Equities
Q2 earnings weekly performances :
Tesla (-19%) Alphabet (-1%) Intel (-5%) TI (-3%) IBM (+2%) Roche (+7%) Novartis (+3%) Nestlé (-5%)
NB :
Soitec (+32% on strong earnings) ST Micro (-13% on poor outlook)
Bank analysts : StandChart (JPM ‘o/w’ target HKD 295 and £22.70) BNPP (Citi ‘buy’ target €115) Dassault Aviation (Rothschild ‘buy’ target €435) HSBC (JPM ‘o/w’ target HKD 200) Richemont (DB ‘buy’ target ₣210) Rio Tinto (BNPP ‘o/w’’ target $116)
M&A : Delivery Hero with an offer from Uber
Rates
US curve steepening (2-10 years) lower at +35ps (-2bps)
HY corp. spreads lower : US at +277bps (+6bps) EU at +250bps (+1bp)
Commodities
Oil price WTI higher (+3%) on renewed attacks (including from Houthis)
Gold price higher (+1%) despite stronger USD (+1%)
Crypto
BTC (-1%) after testing the highs of mid-June ; ETH (+1%) ; SOL (-1%)
Under the watch
Alphabet closed below its 200 day MA for the first time over a year
Hyperscalers FCF forecasts deteriorating fast (2025 at +$190bn, 2026 +$20bn, 2027 forecast turns negative at -$25bn)
Nota Bene
US oil reserves (45 days supply vs 65 days average, 90 days 2022 peak)
US Data Centres (projected to reach 20% of US electricity consumption by 2035 vs 6% now)
CALENDAR
Earnings releases : US Coca-Cola (28 July) Microsoft, Meta, P&G (29) Apple, Amazon (30) Exxon, AbbVie, Chevron (31)
EU AstraZeneca, LVMH (27 July) Shell (30)
Macro : US FED/FOMC (29 July) June PCE (30)
WHAT ANALYSTS SAY
Vanguard Europe, 23 July 2026
Authors : Viktor Nossek, Head of Investment and Product Analytics
The appeal of free cash flow
Global dividend payouts reached a record high of $881bn in Q2 2026, this represents an 8% increase year-on-year.
Europe, including the UK, accounted for the bulk of this growth, with dividend payouts totalling $323bn. Improving fundamentals in North America and emerging markets (excluding China), underpinned by strong balance sheets and significant cash flows from commodities, also contributed to the rise in dividends. The financial sector dominates in Europe.
European companies made their mark in Q2 in terms of both the volume and the composition of dividend payments. Financial stocks, which regularly feature among the world’s 20 largest dividend payers at the peak of the dividend season, dominated the payouts. In Europe (excluding the UK), dividends rose by 6% year-on-year, mainly thanks to substantial payouts from insurers and banks (+$15bn). Combined with dividends paid by major consumer staples groups, these payments offset the decline in payouts in the consumer discretionary sector. Companies in the automotive and luxury goods sectors, either reduced their ordinary dividends or maintained them at the previous year’s levels.
In the UK, dividend growth was supported by a wide range of sectors. Companies in the financials, materials, consumer staples and energy sectors contributed to a strong 12% year-on-year increase. The trading activities of major energy groups benefited from high and volatile commodity prices, boosting both cash flows and distributions to shareholders.
Technology becomes the main driver of growth in North America
In H1 2026, dividends paid in North America rose sharply, increasing by $17bn (+9%) to reach $204bn, mainly thanks to distributions from major technology companies and the boom in investment in artificial intelligence. Starting from a relatively low base, the technology sector was the region’s main driver of growth in Q2, with dividends rising by $8bn year-on-year – more than 3 times the contribution from the financial sector. In absolute terms, North American technology companies have now reached a significant scale in terms of dividend payments. With total distributions of $35bn, the sector has almost caught up with the financial sector, which paid out $35.6bn.
The next growth driver could be the ‘hyperscalers’, whose growing size and maturity are enabling them to adopt more generous dividend policies. Whilst current distributions remain modest relative to the cash flows generated, they point to a clear trend: large technology companies are gradually moving away from discretionary capital returns in the form of share buy-backs in favour of more regular distributions to shareholders in the form of dividends.
Emerging markets excluding China also contributed significantly to dividend growth in Q2. Distributions rose by $16.7bn, or 16% year-on-year, to reach $144bn. The financials, consumer discretionary, materials and industrials sectors all contributed to this sharp rise in distributions across the region.
Over the course of the year, attention will also focus on the growing importance of US technology companies and their ability to continue their transition from a capital allocation policy based on share buy-backs towards the regular payment of dividends. This issue is particularly relevant given that the investment cycle in AI may have reached excessive levels and may not be generating a sufficient return on invested capital.
For investors exposed to global equity indices, dividends paid by US technology companies are increasingly complementing the cyclical distributions from international markets outside the US, where financial and energy companies continue to dominate the dividend landscape. Their growing contribution could reduce the seasonality of dividends and significantly alter the income profile of growth-oriented portfolios. As mature technology companies become increasingly significant dividend payers, they are helping to blur the traditional boundary between ‘value’ investing – which relies heavily on the reinvestment of earnings – and growth investing, which has historically been driven primarily by capital appreciation.
Natixis IM, 21 July 2026
Authors : Mabrouk Chetouane, International Markets Strategy Director
Both in local currency and in foreign currencies, Japanese equity indices have outperformed the major international equity indices. Since the start of the year, the Topix has recorded a return of 15% in local currency, or 11% in USD, whilst its US counterpart (the S&P 500) has risen by just 8.7% in USD. Although the continued depreciation of the yen is one of the factors commonly cited to explain the sharp rise in Japanese share prices, an analysis of recent trends reveals that other variables are behind this outperformance.
On the macroeconomic front, Japan has confirmed its definitive exit from deflation, with the central bank expected to continue gradually tightening its monetary policy – a sign of a normalising economic environment. The rebound in inflation, which is expected in the coming weeks and is likely to support a Phillips curve effect, is occurring against a backdrop of rising labour productivity.
This combination is a prerequisite for preserving corporate margins and, consequently, for increasing profits. Investors therefore believe that the Japanese economy is now operating on the basis of higher nominal growth and, consequently, a trend towards stronger profits.
A breakdown of the Topix’s performance reveals an equal contribution from earnings growth and the ‘valuation’ factor, which is linked to market sentiment. This distribution of performance drivers is, by its very nature, healthier than that of European indices, whose gains are driven exclusively by valuation and are naturally more volatile. Given broadly equivalent valuation levels (a price-earnings ratio of 16.4 for the Topix and 15.3 for the Eurostoxx 50), international investors are more likely to seek exposure to the Japanese market due to this balanced distribution of growth drivers. With a view to diversification, international investors favour Japanese indices as being more balanced than European indices and less expensive than US indices. The increase in capital flows into Japan illustrates this search by investors for a better balance between growth and valuation.
Faced with the steamroller represented by the semiconductor and new technology sectors, the Japanese equity market offers an alternative, particularly for reducing the risk of sectoral concentration. Although the technology sector is a significant contributor to the index’s performance, it is closely followed by the banking sector, which is expected to continue to benefit from the Bank of Japan’s monetary policy stance and a growth cycle characterised by a revival in domestic demand, as well as by the industrial sector, which is capitalising on this new technological revolution. By their very structure, Japanese equity indices offer a solution to the growing concentration seen in many stock market indices, which can act as a deterrent for many international investors.
Added to this set of factors is the transformation of corporate governance, supported by the regulator and the Tokyo Stock Exchange. The implementation of this structural reform – which began several years ago and is now bearing fruit – is leading to an increase in share buybacks and higher dividend payouts, whilst supporting targets to improve return on equity (RoE). Although headwinds linked to the international environment may occasionally weigh on Japanese equities, economic normalisation, geographical and sectoral diversification, and the structural reforms being implemented offer significant potential for appreciation. Japan has emerged from its lean period, and its resilience – along with its capacity for innovation and investment – will enable its companies and their share prices to grow within a sound framework.
Nouriel Roubini, 17 July 2026
Authors : Nouriel Roubini (Advisor at Hudson Bay, Professor at University of NY)
Whilst we are experiencing the most significant disruption to global oil supplies in history, the repercussions are currently less severe than those of the oil crises of the 1970s. Iran’s strategy remains focused on using oil as a weapon, a practice that is by no means new. Some historians believe that Germany lost the First World War partly because a naval blockade imposed by the Allies had deprived it of oil. The Japanese Empire took the fateful decision to attack the US fleet at Pearl Harbour because the administration of US President Franklin Roosevelt had imposed an oil embargo on it following its invasion of China. Similarly, as Stalin would later state, one of the main reasons the Nazis were defeated during the Second World War was that the Soviets had prevented the Axis powers from seizing the oil fields in the Caucasus.
After the Second World War, the Suez Crisis of 1956 disrupted oil supplies from the Middle East to Europe, as France, the United Kingdom and Israel launched an operation to seize the Suez Canal following its nationalisation by Egypt. (These powers were eventually forced to withdraw under pressure from the United States, which sought to prevent a conflict in which the Soviets might become involved.) Some ten years later, the Six-Day War between Israel and several Arab states was triggered by an attempt by Egypt to block Iranian oil supplies bound for Israel via the Strait of Tiran. Following the oil crises of the 1970s, the major oil-consuming powers – notably the United States, Europe, China and Japan – have also built up strategic oil reserves, which can be released in the event of a price spike (a major source of resilience this year). Similarly, alternatives to oil – natural gas, renewable energy and new, safer modular nuclear reactors (with fusion energy likely to emerge over the next decade) – have gained ground and market share. In future, a growing share of energy demand (linked to electric vehicles and batteries) will be met by electricity that can be generated without oil.
At the same time, the standard macroeconomic response (fiscal and monetary) to shocks has improved, which has helped to prevent inflation expectations from becoming unanchored in a manner comparable to that of the 1970s. It is partly thanks to these factors that oil shocks have become less persistent and shorter-lived than those of the 1970s, which lasted for nearly a decade. The oil shock of 1990–1991 lasted 9 months; the one in 2000–01 proved even shorter; and the one that followed the 12-Day War last year came to an end in just a few weeks.
Finally, and most importantly, unlike previous episodes in which macroeconomic and stock market trends were dominated by an oil shock turning into a negative shock to global supply, the current situation is characterised by a secular positive shock to global supply, in the form of a boom in investment in AI. The tailwinds from the technology sector are fuelling stronger growth and lower inflation in many countries and regions, which explains why US equities reached new highs even as the price of oil exceeded $100 a barrel this spring. Although a correction has occurred since hostilities resumed, it remains moderate. Of course, if the recent skirmishes were to lead to a full-scale escalation of hostilities, the economic consequences and market repercussions could be more severe, with a protracted conflict heightening the risk of genuine stagflation.
This is not the base-case scenario, but recent developments suggest that the tail risks are greater than financial markets currently anticipate.
Equities
Q2 earnings weekly performances :
Tesla (-19%) Alphabet (-1%) Intel (-5%) TI (-3%) IBM (+2%) Roche (+7%) Novartis (+3%) Nestlé (-5%)
NB :
Soitec (+32% on strong earnings) ST Micro (-13% on poor outlook)
Bank analysts : StandChart (JPM ‘o/w’ target HKD 295 and £22.70) BNPP (Citi ‘buy’ target €115) Dassault Aviation (Rothschild ‘buy’ target €435) HSBC (JPM ‘o/w’ target HKD 200) Richemont (DB ‘buy’ target ₣210) Rio Tinto (BNPP ‘o/w’’ target $116)
M&A : Delivery Hero with an offer from Uber
Rates
US curve steepening (2-10 years) lower at +35ps (-2bps)
HY corp. spreads lower : US at +277bps (+6bps) EU at +250bps (+1bp)
Commodities
Oil price WTI higher (+3%) on renewed attacks (including from Houthis)
Gold price higher (+1%) despite stronger USD (+1%)
Crypto
BTC (-1%) after testing the highs of mid-June ; ETH (+1%) ; SOL (-1%)
Under the watch
Alphabet closed below its 200 day MA for the first time over a year
Hyperscalers FCF forecasts deteriorating fast (2025 at +$190bn, 2026 +$20bn, 2027 forecast turns negative at -$25bn)
Nota Bene
US oil reserves (45 days supply vs 65 days average, 90 days 2022 peak)
US Data Centres (projected to reach 20% of US electricity consumption by 2035 vs 6% now)
CALENDAR
Earnings releases : US Coca-Cola (28 July) Microsoft, Meta, P&G (29) Apple, Amazon (30) Exxon, AbbVie, Chevron (31)
EU AstraZeneca, LVMH (27 July) Shell (30)
Macro : US FED/FOMC (29 July) June PCE (30)
WHAT ANALYSTS SAY
Vanguard Europe, 23 July 2026
Authors : Viktor Nossek, Head of Investment and Product Analytics
The appeal of free cash flow
Global dividend payouts reached a record high of $881bn in Q2 2026, this represents an 8% increase year-on-year.
Europe, including the UK, accounted for the bulk of this growth, with dividend payouts totalling $323bn. Improving fundamentals in North America and emerging markets (excluding China), underpinned by strong balance sheets and significant cash flows from commodities, also contributed to the rise in dividends. The financial sector dominates in Europe.
European companies made their mark in Q2 in terms of both the volume and the composition of dividend payments. Financial stocks, which regularly feature among the world’s 20 largest dividend payers at the peak of the dividend season, dominated the payouts. In Europe (excluding the UK), dividends rose by 6% year-on-year, mainly thanks to substantial payouts from insurers and banks (+$15bn). Combined with dividends paid by major consumer staples groups, these payments offset the decline in payouts in the consumer discretionary sector. Companies in the automotive and luxury goods sectors, either reduced their ordinary dividends or maintained them at the previous year’s levels.
In the UK, dividend growth was supported by a wide range of sectors. Companies in the financials, materials, consumer staples and energy sectors contributed to a strong 12% year-on-year increase. The trading activities of major energy groups benefited from high and volatile commodity prices, boosting both cash flows and distributions to shareholders.
Technology becomes the main driver of growth in North America
In H1 2026, dividends paid in North America rose sharply, increasing by $17bn (+9%) to reach $204bn, mainly thanks to distributions from major technology companies and the boom in investment in artificial intelligence. Starting from a relatively low base, the technology sector was the region’s main driver of growth in Q2, with dividends rising by $8bn year-on-year – more than 3 times the contribution from the financial sector. In absolute terms, North American technology companies have now reached a significant scale in terms of dividend payments. With total distributions of $35bn, the sector has almost caught up with the financial sector, which paid out $35.6bn.
The next growth driver could be the ‘hyperscalers’, whose growing size and maturity are enabling them to adopt more generous dividend policies. Whilst current distributions remain modest relative to the cash flows generated, they point to a clear trend: large technology companies are gradually moving away from discretionary capital returns in the form of share buy-backs in favour of more regular distributions to shareholders in the form of dividends.
Emerging markets excluding China also contributed significantly to dividend growth in Q2. Distributions rose by $16.7bn, or 16% year-on-year, to reach $144bn. The financials, consumer discretionary, materials and industrials sectors all contributed to this sharp rise in distributions across the region.
Over the course of the year, attention will also focus on the growing importance of US technology companies and their ability to continue their transition from a capital allocation policy based on share buy-backs towards the regular payment of dividends. This issue is particularly relevant given that the investment cycle in AI may have reached excessive levels and may not be generating a sufficient return on invested capital.
For investors exposed to global equity indices, dividends paid by US technology companies are increasingly complementing the cyclical distributions from international markets outside the US, where financial and energy companies continue to dominate the dividend landscape. Their growing contribution could reduce the seasonality of dividends and significantly alter the income profile of growth-oriented portfolios. As mature technology companies become increasingly significant dividend payers, they are helping to blur the traditional boundary between ‘value’ investing – which relies heavily on the reinvestment of earnings – and growth investing, which has historically been driven primarily by capital appreciation.
Natixis IM, 21 July 2026
Authors : Mabrouk Chetouane, International Markets Strategy Director
Both in local currency and in foreign currencies, Japanese equity indices have outperformed the major international equity indices. Since the start of the year, the Topix has recorded a return of 15% in local currency, or 11% in USD, whilst its US counterpart (the S&P 500) has risen by just 8.7% in USD. Although the continued depreciation of the yen is one of the factors commonly cited to explain the sharp rise in Japanese share prices, an analysis of recent trends reveals that other variables are behind this outperformance.
On the macroeconomic front, Japan has confirmed its definitive exit from deflation, with the central bank expected to continue gradually tightening its monetary policy – a sign of a normalising economic environment. The rebound in inflation, which is expected in the coming weeks and is likely to support a Phillips curve effect, is occurring against a backdrop of rising labour productivity.
This combination is a prerequisite for preserving corporate margins and, consequently, for increasing profits. Investors therefore believe that the Japanese economy is now operating on the basis of higher nominal growth and, consequently, a trend towards stronger profits.
A breakdown of the Topix’s performance reveals an equal contribution from earnings growth and the ‘valuation’ factor, which is linked to market sentiment. This distribution of performance drivers is, by its very nature, healthier than that of European indices, whose gains are driven exclusively by valuation and are naturally more volatile. Given broadly equivalent valuation levels (a price-earnings ratio of 16.4 for the Topix and 15.3 for the Eurostoxx 50), international investors are more likely to seek exposure to the Japanese market due to this balanced distribution of growth drivers. With a view to diversification, international investors favour Japanese indices as being more balanced than European indices and less expensive than US indices. The increase in capital flows into Japan illustrates this search by investors for a better balance between growth and valuation.
Faced with the steamroller represented by the semiconductor and new technology sectors, the Japanese equity market offers an alternative, particularly for reducing the risk of sectoral concentration. Although the technology sector is a significant contributor to the index’s performance, it is closely followed by the banking sector, which is expected to continue to benefit from the Bank of Japan’s monetary policy stance and a growth cycle characterised by a revival in domestic demand, as well as by the industrial sector, which is capitalising on this new technological revolution. By their very structure, Japanese equity indices offer a solution to the growing concentration seen in many stock market indices, which can act as a deterrent for many international investors.
Added to this set of factors is the transformation of corporate governance, supported by the regulator and the Tokyo Stock Exchange. The implementation of this structural reform – which began several years ago and is now bearing fruit – is leading to an increase in share buybacks and higher dividend payouts, whilst supporting targets to improve return on equity (RoE). Although headwinds linked to the international environment may occasionally weigh on Japanese equities, economic normalisation, geographical and sectoral diversification, and the structural reforms being implemented offer significant potential for appreciation. Japan has emerged from its lean period, and its resilience – along with its capacity for innovation and investment – will enable its companies and their share prices to grow within a sound framework.
Nouriel Roubini, 17 July 2026
Authors : Nouriel Roubini (Advisor at Hudson Bay, Professor at University of NY)
Whilst we are experiencing the most significant disruption to global oil supplies in history, the repercussions are currently less severe than those of the oil crises of the 1970s. Iran’s strategy remains focused on using oil as a weapon, a practice that is by no means new. Some historians believe that Germany lost the First World War partly because a naval blockade imposed by the Allies had deprived it of oil. The Japanese Empire took the fateful decision to attack the US fleet at Pearl Harbour because the administration of US President Franklin Roosevelt had imposed an oil embargo on it following its invasion of China. Similarly, as Stalin would later state, one of the main reasons the Nazis were defeated during the Second World War was that the Soviets had prevented the Axis powers from seizing the oil fields in the Caucasus.
After the Second World War, the Suez Crisis of 1956 disrupted oil supplies from the Middle East to Europe, as France, the United Kingdom and Israel launched an operation to seize the Suez Canal following its nationalisation by Egypt. (These powers were eventually forced to withdraw under pressure from the United States, which sought to prevent a conflict in which the Soviets might become involved.) Some ten years later, the Six-Day War between Israel and several Arab states was triggered by an attempt by Egypt to block Iranian oil supplies bound for Israel via the Strait of Tiran. Following the oil crises of the 1970s, the major oil-consuming powers – notably the United States, Europe, China and Japan – have also built up strategic oil reserves, which can be released in the event of a price spike (a major source of resilience this year). Similarly, alternatives to oil – natural gas, renewable energy and new, safer modular nuclear reactors (with fusion energy likely to emerge over the next decade) – have gained ground and market share. In future, a growing share of energy demand (linked to electric vehicles and batteries) will be met by electricity that can be generated without oil.
At the same time, the standard macroeconomic response (fiscal and monetary) to shocks has improved, which has helped to prevent inflation expectations from becoming unanchored in a manner comparable to that of the 1970s. It is partly thanks to these factors that oil shocks have become less persistent and shorter-lived than those of the 1970s, which lasted for nearly a decade. The oil shock of 1990–1991 lasted 9 months; the one in 2000–01 proved even shorter; and the one that followed the 12-Day War last year came to an end in just a few weeks.
Finally, and most importantly, unlike previous episodes in which macroeconomic and stock market trends were dominated by an oil shock turning into a negative shock to global supply, the current situation is characterised by a secular positive shock to global supply, in the form of a boom in investment in AI. The tailwinds from the technology sector are fuelling stronger growth and lower inflation in many countries and regions, which explains why US equities reached new highs even as the price of oil exceeded $100 a barrel this spring. Although a correction has occurred since hostilities resumed, it remains moderate. Of course, if the recent skirmishes were to lead to a full-scale escalation of hostilities, the economic consequences and market repercussions could be more severe, with a protracted conflict heightening the risk of genuine stagflation.
This is not the base-case scenario, but recent developments suggest that the tail risks are greater than financial markets currently anticipate.
Contacts
8 Kievyan Street, Yerevan, Armenia
+374 10 712 259
+374 43 004 182
unibankinvest@unibank.am
info@unibankinvest.am
Disclaimer
The information presented in the document contains a general overview of the products and services offered by Unibank OJSC (registered trademark – Unibank Invest, hereinafter referred to as the Bank).
The information is intended solely for the attention of the persons to whom it is addressed. Further dissemination of this information is allowed only with the prior consent of the Bank.
The information is only indicative, is not exhaustive and is provided solely for discussion purposes. The information should not be regarded as a public offer, request or invitation to purchase or sell any securities, financial instruments or services. The Bank reserves the right to make a final decision on the provision of these products and/or services to a specific customer, including refusing to provide products and/or services if such activities would be contrary to applicable law.
No guarantees in direct or indirect form, including those stipulated by law, are provided in connection with the specified information and materials. The information presented above cannot be considered as a recommendation for investing funds, as well as guarantees or promises of future profitability of investments.