
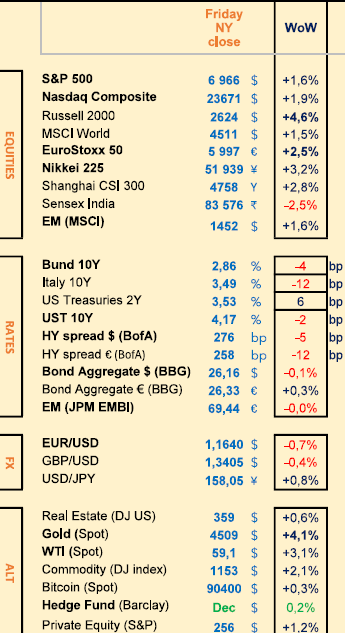
Last week: Stocks rally continued (especially SMEs and Defense); Oil/Gold/Silver/Copper prices much higher
WEEKLY TRENDS
WEEKLY TRENDS
- Stocks continued their rally, with US SMEs outperforming (Russell +4.5%) while Nasdaq was at +2% and the S&P at +1.5%. Defense stocks pushed up European indices
- Dec US NFP was lower than expected and previous months figures were revised down too (by -76k combined), but the FED is not expected to cut this month on Jan 28th (85% probability according to FedWatch) but 2 cuts are priced in for 2026 (starting on 18 March)
- Oil price was much higher (+3%) and so was Gold (+4%) as protests in Iran keep escalating. Silver surged by 10% last week and Copper hit a record of $13k a tonne in London (at the LME)
- The USD had a strong start of the year, rising to one month highs while President Trump directed the purchase of $200bn in mortgage bonds to bring housing costs down (buying MBS via Fannie Mae and Freddie Mac)
- New US corporate Q4 2025 earnings season will start as soon as Tuesday, with JP Morgan and Bank of New York. In Europe Richemont will follow on Thursday. Else, the US will publish its latest CPI inflation data from Dec, this coming Tuesday
MARKETS
Equities
Weekly performances:
Rheinmetall (+16%), Leonardo (+15%), Thales (+13%), Hensoldt (+15%)
Abivax (-14%) due to no more interest from Elli Lilly
M&A: Rio Tinto and Glencore are to merge ($263bn conglomerate)
Bank analysts: Eiffage (MS ‘o/w’ target €172), Arcelor (MS ‘o/w’ target €46), Schindler (JPM ‘o/w’ target ₣340), Legrand (MS ‘o/w’ target €138), Arkema (MS ‘o/w’ target €78)
Rates
US curve steepening (2-10 years) lower at 64bps (-8bps)
HY corp. spreads lower : US at +276bps (-5); EU at +258bps (-10)
Commodities
Oil price higher (+3%) the biggest rise since October, and third straight weekly gain as Iran protests escalate
Gold price higher (+4%) despite a stronger USD
EM
BRL and MXN (related resources commodities currencies) open interests net long Futures show strong interests by traders
US
Dec NFP (+50k vs 60k expected) Oct revised down by -68k and Nov by -8k - unemployment rate fell to 4.4% from 4.6% in Nov
Dec ISM Manufacturing PMI at 47.9 (a 14 month low)
Under the watch
2026 commodities index rebalancing (8-14 Jan window) BCOM Silver weigh is to drop from 9.5% to 1.5% (GS estimates)
Nota Bene
S&P Global warned of a 10m tonne copper deficit by 2040, due to AI & Data Centres, EVs, copper treated as a national security asset
Stablecoins transactions have reached a new record at $33trn in 2025 (+80%) and could reach $56trn by 2030 according to Bloomberg Intelligence services
CALENDAR
Earnings releases:
US JP Morgan, BoNY (13 Jan), BofA, Wells Fargo, Citi (14), MS, BlackRock, GS (14), State Street (16)
Macro releases:
US Dec CPI (13 Jan)
Central Bank rate decisions:
FED/FOMC (28 Jan)
WHAT ANALYSTS SAY
Fidelity International, 9 January 2026
Author: Daniel Ushakov, Fund Manager, multiple asset classes
A key question is how much debt will ultimately finance the significant AI-related investments planned by technology companies.
Bond issuance is beginning to increase, supported by strong demand, but any macroeconomic setback could widen borrowing costs, especially if interest rates remain high. Meta illustrates this trend: in October, the company issued $30bn in bonds that attracted nearly $120bn in demand, following a $27.3bn financing agreement with Blue Owl related to data centre lease payments. Meta is expected to generate approximately $20bn in free cash flow in 2026 but anticipates nearly $70bn in AI infrastructure spending. Oracle and Google issued $13bn and $12bn respectively at the end of 2025, also with strong demand. With continued investment in AI data centres and the growing use of debt financing, the share of AI-related debt in investment grade markets is expected to increase.
One concern is the growing adoption of open language models (LLMs) from China, which could shift the AI business dynamic in favour of manufacturing and put pressure on hyperscaler valuations.
Another issue is the shift in the bottleneck for data centres from chips to energy supply, as evidenced by the sharp decline in GPU rental prices.
The pace of improvement and adoption of LLMs shows uncertain momentum, monetisation horizons remain unclear, and circular investment structures between large technology companies and AI companies expose valuations to risks. Amazon offers another illustration. Its free cash flow recently declined year-on-year, exacerbated by an AWS outage. Earnings were supported by a valuation gain on its stake in Anthropic; without this, earnings per share and net income would have declined, reflecting a dynamic seen in other technology-AI partnerships where cloud results benefit from integrated AI models, while underlying performance appears weaker.
Credit analysis remains focused on fundamentals. Although the enthusiasm for investment in artificial intelligence carries certain downside risks, technology companies issuing debt to finance their projects in this area generally have high credit quality, supported by a solid cash position, stable cash flow generation and controlled debt levels. AI-related issues with reasonable premiums and robust fundamentals remain attractive.
However, increased vigilance is warranted in the event of an increase in issues within more speculative segments of the AI ecosystem, particularly when investments are based more on expected cash flows than on current revenues.
While technology stocks continue to rise, consumer-focused sectors are experiencing a slowdown. Many companies offering non-essential goods have reported a decline in spending among low- and middle-income households, which is also reflected in recent reactions to financial results. In Las Vegas, visitor numbers are expected to fall significantly compared to 2024, with marked disparities between high-end and budget operators. Waves of layoffs in major industries are putting additional pressure on consumers, with job losses in October reaching their highest level since before 2008 as companies seek to optimise efficiency through artificial intelligence.
Credit risk remains underweighted given current valuations. Exposure was reduced during the market rally, while selective participation in high-quality new issues continues.
The possibility of adding risk remains open if valuations become more attractive.
Schroders, 6 January 2026
Authors: Alex Tedder, Head of global equity
It is understandable that the focus is on the degree of concentration in equity markets, particularly in the United States. The ten largest technology stocks now account for nearly 40% of the S&P 500's market capitalisation, an unprecedented level. However, historical analysis shows that every major wave of innovation has been accompanied by prolonged periods of high sector concentration. What distinguishes the current phase of technology-driven innovation is the overlap of several major innovation cycles, the most recent (and fastest) of which is evident in the field of large language models, or generative AI. The remarkable performance of the ‘Magnificent 7 (Alphabet, Amazon, Apple, Meta, Microsoft, Nvidia and Tesla) has been driven by huge investments in AI infrastructure. Even with the recent increase in their capital expenditure, it remains moderate as a proportion of their operating cash flow, offering significant room for growth in the years to come.
As investment amounts increase, questions about potential return on investment and the circularity of the AI supply chain are also intensifying. This year, the largest companies account for more than 70% of total capital expenditure in the S&P 500, so it is no exaggeration to say that the future direction of the US equity market depends largely on continued confidence in the future of AI. For now, that confidence remains intact. Admittedly, there are some signs of irrational exuberance, as evidenced by the spectacular stock market performance of AI-related players with no revenue or profits. However, the total market capitalisation of these companies remains marginal. At this stage, the real question is whether AI models can be monetised at a rate that justifies the massive investments we are seeing. There are already encouraging signs: Alphabet (Google's parent company) has reported a significant impact of AI on its revenue growth in cloud computing, search and even YouTube. Notably, ChatGPT is already generating nearly $20bn in revenue in 2025. According to our analyses, this amount could reach $200bn by 2030. This puts the current market capitalisation of $500bn of the parent company OpenAI into perspective. If the company were publicly traded, a realistic valuation would be 10 times projected sales, implying a market capitalisation of £2trn. Given that Nvidia, a manufacturer of AI chips, currently has a valuation of $5trn, the enthusiasm for investing in AI seems much more rational.
Our optimism about the outlook for 2026 is accompanied by a keen awareness of the persistent risks. If the upward trend in the markets continues, the likelihood of a major correction increases automatically, especially in a context of already stretched valuations. The adage that ‘bull markets don't die of old age’ still holds true: it usually takes a trigger to initiate a significant correction. At this stage, no obvious catalyst has been identified, but the next one is likely to come from the bond market. Trump's policies, while effective in the short term, could lead to inflationary pressures or increase public debt levels. Similarly, the British economy, which is already struggling to find avenues for growth, could be overwhelmed by the weight of tax-funded public spending, ultimately requiring a bailout. Many other factors could also act as catalysts, prompting a return to more reasonable valuations. In such an environment, most assets would likely suffer. However, within the equity markets, a segment comprising unpopular companies that generate cash flow and have a solid financial position could fare well. A targeted strengthening of stocks in the healthcare, consumer staples and utilities sectors would likely offer valuable diversification during a potential correction.
Given their weight, China, India, Taiwan and Korea dominate the beta of emerging markets. However, for active investors, the universe is full of alpha opportunities. Among the markets currently offering favourable conditions, we believe Brazil warrants an overweight position. Brazilian equities are particularly attractively valued, the real effective exchange rate is low and real interest rates are very high. The October 2026 elections in Brazil could see President Luiz Inácio Lula da Silva lose to a centre-right candidate. A more fiscally responsible centre-right government would ease concerns about the sustainability of public finances and lead to a significant tightening of real interest rates.
Ossiam, 7 January 2026
Authors: Patrick Artus, Economic counsellor
Since Mario Draghi's report, many economists have focused on Europe's lag behind the United States. The first difficulty lies in measuring this lag, which can be assessed using various indicators: GDP per capita, GDP per capita in volume terms, GDP per capita in purchasing power parity terms, or hourly productivity. Hourly productivity is used here as a measure of the relative productive efficiency of economies. Between 2002 and 2023, hourly productivity grew 12% more in the United States than in the European Union, and 16% more than in the euro area.
This raises the question of why this gap exists. It is mainly due to the slow development of information and communication technologies in Europe. This can be linked to low spending on research and development, low investment in new technologies, and strong employment protection.
We observe that comparing GDP per capita in dollars is not relevant, as GDP growth in the United States also reflects higher price increases than in Europe ; that GDP in volume terms grew by around 6% more in the United States than in the European Union between 2002 and 2025 ; GDP per capita in constant dollars and purchasing power parity has grown more slowly in the European Union than in the United States since 2002 ; hourly productivity has increased by 12% more in the United States than in the European Union and by 16% more than in the euro area between 2002 and 2023.
We prefer to compare hourly productivity, as GDP in volume terms includes non-market GDP, in particular the value added by public administrations, which is measured on a flat-rate basis. Furthermore, GDP in purchasing power parity is based on a delicate comparison of price levels. This measure of productivity indicates that the productive efficiency of the United States increased by about 12% relative to that of the European Union between 2002 and 2023.
The average annual gap between productivity gains in the information and communication technology (ICT) sectors in the United States and the euro area over the period 2002–2024 is 4.5 percentage points per year. This gap is particularly pronounced between 2003 and 2011.
Over the same period, the average annual gap in productivity gains across the economy as a whole is just under 0.6 percentage points per year. In 2022, ICT accounted for 7.3% of GDP in the United States, compared with 4.9% in the euro area.
If the euro area had the same share of ICT in GDP as the United States, as well as comparable productivity growth in ICT, it would benefit from an additional productivity gain of 0.52 percentage points per year, which would represent 87% of the productivity gap observed between the United States and the euro area since 2002.
Per capita GDP grew by 6.2% less between 2002 and 2024 in Europe than in the United States. Over the same period, hourly labour productivity increased by 12% less between 2002 and 2023 in Europe than in the United States.
This loss of income per worker is mainly due to the smaller size of the information and communication technology sector in Europe compared to the United States, as well as lower productivity gains in this sector.
This smaller size and lower productivity gains are the result of low spending on research and development, low investment in new technologies, and strong employment protection in Europe.
Equities
Weekly performances:
Rheinmetall (+16%), Leonardo (+15%), Thales (+13%), Hensoldt (+15%)
Abivax (-14%) due to no more interest from Elli Lilly
M&A: Rio Tinto and Glencore are to merge ($263bn conglomerate)
Bank analysts: Eiffage (MS ‘o/w’ target €172), Arcelor (MS ‘o/w’ target €46), Schindler (JPM ‘o/w’ target ₣340), Legrand (MS ‘o/w’ target €138), Arkema (MS ‘o/w’ target €78)
Rates
US curve steepening (2-10 years) lower at 64bps (-8bps)
HY corp. spreads lower : US at +276bps (-5); EU at +258bps (-10)
Commodities
Oil price higher (+3%) the biggest rise since October, and third straight weekly gain as Iran protests escalate
Gold price higher (+4%) despite a stronger USD
EM
BRL and MXN (related resources commodities currencies) open interests net long Futures show strong interests by traders
US
Dec NFP (+50k vs 60k expected) Oct revised down by -68k and Nov by -8k - unemployment rate fell to 4.4% from 4.6% in Nov
Dec ISM Manufacturing PMI at 47.9 (a 14 month low)
Under the watch
2026 commodities index rebalancing (8-14 Jan window) BCOM Silver weigh is to drop from 9.5% to 1.5% (GS estimates)
Nota Bene
S&P Global warned of a 10m tonne copper deficit by 2040, due to AI & Data Centres, EVs, copper treated as a national security asset
Stablecoins transactions have reached a new record at $33trn in 2025 (+80%) and could reach $56trn by 2030 according to Bloomberg Intelligence services
CALENDAR
Earnings releases:
US JP Morgan, BoNY (13 Jan), BofA, Wells Fargo, Citi (14), MS, BlackRock, GS (14), State Street (16)
Macro releases:
US Dec CPI (13 Jan)
Central Bank rate decisions:
FED/FOMC (28 Jan)
WHAT ANALYSTS SAY
- Fidelity: The craze for AI-related bonds
- Schroders: Global equities, the case for cautious optimism
- Ossiam: Europe's productive lag behind the United States
Fidelity International, 9 January 2026
Author: Daniel Ushakov, Fund Manager, multiple asset classes
A key question is how much debt will ultimately finance the significant AI-related investments planned by technology companies.
Bond issuance is beginning to increase, supported by strong demand, but any macroeconomic setback could widen borrowing costs, especially if interest rates remain high. Meta illustrates this trend: in October, the company issued $30bn in bonds that attracted nearly $120bn in demand, following a $27.3bn financing agreement with Blue Owl related to data centre lease payments. Meta is expected to generate approximately $20bn in free cash flow in 2026 but anticipates nearly $70bn in AI infrastructure spending. Oracle and Google issued $13bn and $12bn respectively at the end of 2025, also with strong demand. With continued investment in AI data centres and the growing use of debt financing, the share of AI-related debt in investment grade markets is expected to increase.
One concern is the growing adoption of open language models (LLMs) from China, which could shift the AI business dynamic in favour of manufacturing and put pressure on hyperscaler valuations.
Another issue is the shift in the bottleneck for data centres from chips to energy supply, as evidenced by the sharp decline in GPU rental prices.
The pace of improvement and adoption of LLMs shows uncertain momentum, monetisation horizons remain unclear, and circular investment structures between large technology companies and AI companies expose valuations to risks. Amazon offers another illustration. Its free cash flow recently declined year-on-year, exacerbated by an AWS outage. Earnings were supported by a valuation gain on its stake in Anthropic; without this, earnings per share and net income would have declined, reflecting a dynamic seen in other technology-AI partnerships where cloud results benefit from integrated AI models, while underlying performance appears weaker.
Credit analysis remains focused on fundamentals. Although the enthusiasm for investment in artificial intelligence carries certain downside risks, technology companies issuing debt to finance their projects in this area generally have high credit quality, supported by a solid cash position, stable cash flow generation and controlled debt levels. AI-related issues with reasonable premiums and robust fundamentals remain attractive.
However, increased vigilance is warranted in the event of an increase in issues within more speculative segments of the AI ecosystem, particularly when investments are based more on expected cash flows than on current revenues.
While technology stocks continue to rise, consumer-focused sectors are experiencing a slowdown. Many companies offering non-essential goods have reported a decline in spending among low- and middle-income households, which is also reflected in recent reactions to financial results. In Las Vegas, visitor numbers are expected to fall significantly compared to 2024, with marked disparities between high-end and budget operators. Waves of layoffs in major industries are putting additional pressure on consumers, with job losses in October reaching their highest level since before 2008 as companies seek to optimise efficiency through artificial intelligence.
Credit risk remains underweighted given current valuations. Exposure was reduced during the market rally, while selective participation in high-quality new issues continues.
The possibility of adding risk remains open if valuations become more attractive.
Schroders, 6 January 2026
Authors: Alex Tedder, Head of global equity
It is understandable that the focus is on the degree of concentration in equity markets, particularly in the United States. The ten largest technology stocks now account for nearly 40% of the S&P 500's market capitalisation, an unprecedented level. However, historical analysis shows that every major wave of innovation has been accompanied by prolonged periods of high sector concentration. What distinguishes the current phase of technology-driven innovation is the overlap of several major innovation cycles, the most recent (and fastest) of which is evident in the field of large language models, or generative AI. The remarkable performance of the ‘Magnificent 7 (Alphabet, Amazon, Apple, Meta, Microsoft, Nvidia and Tesla) has been driven by huge investments in AI infrastructure. Even with the recent increase in their capital expenditure, it remains moderate as a proportion of their operating cash flow, offering significant room for growth in the years to come.
As investment amounts increase, questions about potential return on investment and the circularity of the AI supply chain are also intensifying. This year, the largest companies account for more than 70% of total capital expenditure in the S&P 500, so it is no exaggeration to say that the future direction of the US equity market depends largely on continued confidence in the future of AI. For now, that confidence remains intact. Admittedly, there are some signs of irrational exuberance, as evidenced by the spectacular stock market performance of AI-related players with no revenue or profits. However, the total market capitalisation of these companies remains marginal. At this stage, the real question is whether AI models can be monetised at a rate that justifies the massive investments we are seeing. There are already encouraging signs: Alphabet (Google's parent company) has reported a significant impact of AI on its revenue growth in cloud computing, search and even YouTube. Notably, ChatGPT is already generating nearly $20bn in revenue in 2025. According to our analyses, this amount could reach $200bn by 2030. This puts the current market capitalisation of $500bn of the parent company OpenAI into perspective. If the company were publicly traded, a realistic valuation would be 10 times projected sales, implying a market capitalisation of £2trn. Given that Nvidia, a manufacturer of AI chips, currently has a valuation of $5trn, the enthusiasm for investing in AI seems much more rational.
Our optimism about the outlook for 2026 is accompanied by a keen awareness of the persistent risks. If the upward trend in the markets continues, the likelihood of a major correction increases automatically, especially in a context of already stretched valuations. The adage that ‘bull markets don't die of old age’ still holds true: it usually takes a trigger to initiate a significant correction. At this stage, no obvious catalyst has been identified, but the next one is likely to come from the bond market. Trump's policies, while effective in the short term, could lead to inflationary pressures or increase public debt levels. Similarly, the British economy, which is already struggling to find avenues for growth, could be overwhelmed by the weight of tax-funded public spending, ultimately requiring a bailout. Many other factors could also act as catalysts, prompting a return to more reasonable valuations. In such an environment, most assets would likely suffer. However, within the equity markets, a segment comprising unpopular companies that generate cash flow and have a solid financial position could fare well. A targeted strengthening of stocks in the healthcare, consumer staples and utilities sectors would likely offer valuable diversification during a potential correction.
Given their weight, China, India, Taiwan and Korea dominate the beta of emerging markets. However, for active investors, the universe is full of alpha opportunities. Among the markets currently offering favourable conditions, we believe Brazil warrants an overweight position. Brazilian equities are particularly attractively valued, the real effective exchange rate is low and real interest rates are very high. The October 2026 elections in Brazil could see President Luiz Inácio Lula da Silva lose to a centre-right candidate. A more fiscally responsible centre-right government would ease concerns about the sustainability of public finances and lead to a significant tightening of real interest rates.
Ossiam, 7 January 2026
Authors: Patrick Artus, Economic counsellor
Since Mario Draghi's report, many economists have focused on Europe's lag behind the United States. The first difficulty lies in measuring this lag, which can be assessed using various indicators: GDP per capita, GDP per capita in volume terms, GDP per capita in purchasing power parity terms, or hourly productivity. Hourly productivity is used here as a measure of the relative productive efficiency of economies. Between 2002 and 2023, hourly productivity grew 12% more in the United States than in the European Union, and 16% more than in the euro area.
This raises the question of why this gap exists. It is mainly due to the slow development of information and communication technologies in Europe. This can be linked to low spending on research and development, low investment in new technologies, and strong employment protection.
We observe that comparing GDP per capita in dollars is not relevant, as GDP growth in the United States also reflects higher price increases than in Europe ; that GDP in volume terms grew by around 6% more in the United States than in the European Union between 2002 and 2025 ; GDP per capita in constant dollars and purchasing power parity has grown more slowly in the European Union than in the United States since 2002 ; hourly productivity has increased by 12% more in the United States than in the European Union and by 16% more than in the euro area between 2002 and 2023.
We prefer to compare hourly productivity, as GDP in volume terms includes non-market GDP, in particular the value added by public administrations, which is measured on a flat-rate basis. Furthermore, GDP in purchasing power parity is based on a delicate comparison of price levels. This measure of productivity indicates that the productive efficiency of the United States increased by about 12% relative to that of the European Union between 2002 and 2023.
The average annual gap between productivity gains in the information and communication technology (ICT) sectors in the United States and the euro area over the period 2002–2024 is 4.5 percentage points per year. This gap is particularly pronounced between 2003 and 2011.
Over the same period, the average annual gap in productivity gains across the economy as a whole is just under 0.6 percentage points per year. In 2022, ICT accounted for 7.3% of GDP in the United States, compared with 4.9% in the euro area.
If the euro area had the same share of ICT in GDP as the United States, as well as comparable productivity growth in ICT, it would benefit from an additional productivity gain of 0.52 percentage points per year, which would represent 87% of the productivity gap observed between the United States and the euro area since 2002.
Per capita GDP grew by 6.2% less between 2002 and 2024 in Europe than in the United States. Over the same period, hourly labour productivity increased by 12% less between 2002 and 2023 in Europe than in the United States.
This loss of income per worker is mainly due to the smaller size of the information and communication technology sector in Europe compared to the United States, as well as lower productivity gains in this sector.
This smaller size and lower productivity gains are the result of low spending on research and development, low investment in new technologies, and strong employment protection in Europe.
Contacts
8 Kievyan Street, Yerevan, Armenia
+374 10 712 259
+374 43 004 182
unibankinvest@unibank.am
info@unibankinvest.am
Disclaimer
The information presented in the document contains a general overview of the products and services offered by Unibank OJSC (registered trademark – Unibank Invest, hereinafter referred to as the Bank).
The information is intended solely for the attention of the persons to whom it is addressed. Further dissemination of this information is allowed only with the prior consent of the Bank.
The information is only indicative, is not exhaustive and is provided solely for discussion purposes. The information should not be regarded as a public offer, request or invitation to purchase or sell any securities, financial instruments or services. The Bank reserves the right to make a final decision on the provision of these products and/or services to a specific customer, including refusing to provide products and/or services if such activities would be contrary to applicable law.
No guarantees in direct or indirect form, including those stipulated by law, are provided in connection with the specified information and materials. The information presented above cannot be considered as a recommendation for investing funds, as well as guarantees or promises of future profitability of investments.