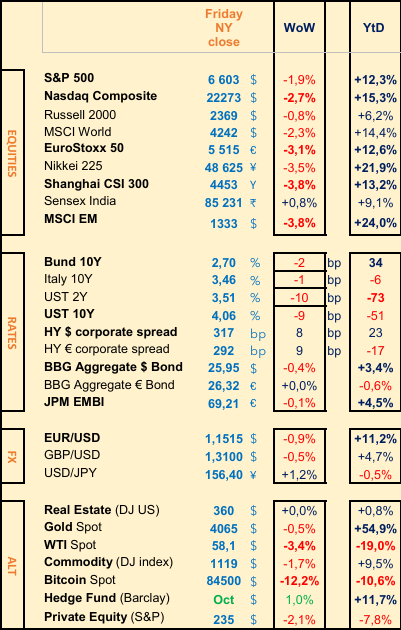
Last week: Sell-off in stocks continued; US Sep NFP released stronger; BTC fell by 12%; US-RU-UA deal ends 27 Nov
WEEKLY TRENDS
WEEKLY TRENDS
- Stocks sell-off continued last week, despite insane Q3 earnings from Nvidia (sales at +62%, net profits at +65%, gross margin at 73%) adding a strong Q4 outlook too. T/P fury after a 6 month rally for US stocks and a 4 month rally for EU stocks
- Options expiry (SP500 for $1.7trn and single stocks for $725bn) fuelled erratic moves last Thursday, pushing the VIX at 28 during the day. Friday was the opposite, with major stock indices moving back above their key 100 day Moving Average support levels
- Last week saw a big rotation in sectors too (Tech is off while Healthcare is on). Risk-Off mood, with BTC falling by 12% last week, amplified by leveraged positions (4th week in a row decline and -27% in a month)
- US Sep NFP were released finally, at +119k vs +50k expected. Next US macro releases will be the Sep PCE Deflator (most important inflation statistics for the FED) and the Sep PPI. Analog devices and Dell will close the US Q3 earnings release season
- Note that Japan adopted a $120bn stimulus package last week to boost the economy in strategic sectors and industries. The BoJ is said to be watching carefully the 160 level to the USD.
MARKETS
Equities
Weekly performances after earnings releases:
Walmart (+2.5%), Home Depot (-5%), Nvidia (-4%)
Soitec (-38%), Osram (-25%), Valeo (-15%)
NB: Dell (-1.5%, MS u/w downgrade); Alphabet (+5%, Berkshire Hathaway $4bn participation); Roche (+10%)
Analysts: Richemont (Barclays ‘o/w’ target ₣192), Nestlé (GS ‘buy’ target ₣93), Vivendi (JPM ‘o/w’ target €2.90), Siemens Energy (HSBC, LBBW and DB ‘buy’ target €130)
Rates
US curve (2-10 years) steepening unchanged at 55bps
HY corp. spreads slightly higher (+5bps, US at 315bps, EU at 290bps)
Commodities
Oil price weaker (-3.5%) stronger USD and US-RU-UA peace talks
Gold slightly lower (-0.5%) due to a stronger USD
UK
Oct inflation slowed at +3.6% boosting chances of a Dec rate cut, post budget delivery (26th Nov)
Japan
Q3 GDP contracted by 1.8% the first decline in 6 quarters (US tariffs)
Crypto
BTC much lower (-12%) amplified by leveraged bets (Cryptos wiped out $1trn market value, total market cap at $2.8trn now)
Under the watch
30 year JGB yield (inflation is running high while BoJ rates are at 0.5%)
Nota Bene
YTD stock indices, top of the class EM at +24% and Nikkei at +22%
M. Wilson (MS well known bear) sees SP500 at $7800 by 2026 yearend
Amazon issued $12bn worth of bonds to finance its AI investments
CALENDAR
Q3 earnings releases:
US Dell, Analog Devices (25 Nov)
Macro releases: US Sep PPI (25 Nov), Sep PCE inflation (26 Nov)
Markets closed: US Thanksgiving (27 Nov)
WHAT ANALYSTS SAY
Vanguard, 17 November 2025
Author: Manon Duez, Senior Executive
While equity ETFs once again dominated subscriptions, at £28.6 billion, demand for bond ETFs accelerated sharply, reaching £17.6 billion – nearly triple the previous month's figure.
This movement took place in a favourable market environment, marked by an easing of trade tensions between the United States and China, strong corporate earnings in the United States and a further cut in Fed interest rates. Investors favoured exposure to the eurozone, which attracted £10.4 billion, an annual high.
Corporate and government bond ETFs also had their best months of 2025, with £7.1 billion and £4.8 billion in subscriptions respectively, while ultra-short-term ETFs continued their series of positive flows (+£3.0 billion).
Since January, ETFs domiciled in Europe have attracted $313.4 billion in net inflows, compared with $213.4 billion in the same period in 2024. Equity ETFs account for $236.9 billion and bond ETFs for $73.0 billion.
Core equity ETFs continued to attract significant net inflows, gaining an additional $15.7 billion in October. Since the beginning of the year, they have totalled $158.5 billion in net subscriptions. Sustainable equity ETFs recorded £5.3 billion in net inflows last month, while thematic ETFs added £3.2 billion. Sector and smart beta ETFs, on the other hand, saw net outflows of £515 million and £374 million, respectively.
US equity ETFs once again led the way, recording £7.4 billion in net inflows in October. This marks the fourth consecutive month of positive flows, following a more irregular trend in the first half of the year. Global equity ETFs and developed market ETFs attracted net inflows of $5.5 billion and $5.2 billion, respectively. ETFs focused on Germany and Europe excluding the United Kingdom, on the other hand, saw net outflows of $847 million and $512 million, respectively.
Corporate bond ETFs recorded £7.1 billion in net subscriptions in October, while government bond ETFs collected £4.8 billion. Notably, both categories have posted identical net flows of £18.4 billion since the beginning of the year. Ultra-short-term bond ETFs enjoyed another month of positive flows, adding £3.0 billion, bringing their cumulative total since January to £25.1 billion – the highest among bond ETF categories. Net outflows were also limited last month across all segments tracked.
Eurozone bond ETFs once again recorded the largest net inflows among bond products, with $10.4 billion collected in October. This marks ten consecutive months of positive inflows in 2025, for a cumulative total of $40.1 billion since the beginning of the year.
US and global bond ETFs also recorded net inflows last month, adding $3.1 billion and $2.8 billion respectively.
Conversely, some single-country bond ETFs experienced relatively modest net outflows.
ING, 17 November 2025
Author: Vincent Juvyns, Chief Investment Strategist
After years of gloom, banks are making a remarkable comeback on the stock market. Their exceptional performance can be explained by three key factors: the steepening of the yield curve, still attractive valuations and solid earnings prospects. This favourable cocktail has put the financial sector back at the heart of asset allocations, alongside technology stocks boosted by the rise of artificial intelligence.
In Europe, the Stoxx 600 banking index has jumped more than 53% since the beginning of the year, reaching levels not seen since 2008. To find a similar performance, we have to go back to 2009 (+47%). This rally, which began in October 2022, brings the cumulative gain to 179%, well above the European (+49%) and US (+57.5% in euros) markets over the same period.
In the United States, growth has been more moderate this year (+22% in dollars), but prices are flirting with historic highs. By way of comparison, the US technology sector is up +23.5% and the ‘Magnificent Seven’ are up +20% this year. In other words, banks have once again become a major player in the stock market.This outperformance is not insignificant: in Europe, the banking sector is the biggest contributor to the market's rise (+13% for the Stoxx Europe 600), ahead of insurers (+20%). In the United States, despite the negative impact of exchange rates (the dollar has fallen against the euro), banks are performing at unprecedented levels. This strong comeback marks the end of a decade of underperformance and confirms that the sector has regained solid fundamentals.
The key lies in the steepening of yield curves. After a period of inversion in 2023, the spread between long- and short-term rates has widened significantly (1.3% in Europe, 1.2% in the United States). Long-term rates are supported by massive public spending and record budget deficits, while short-term rates are falling as a result of accommodative monetary policies. This configuration favours lending, supports margins and fuels dividends, which justifies the sector's re-rating. Investors anticipate that the Federal Reserve will continue to cut short-term rates, while the ECB will maintain an accommodative policy to support a fragile economy. At the same time, massive public spending plans – €500 billion in Germany for defence and infrastructure, and tax reform in the United States that will increase the deficit by $2.4 trillion over 10 years – should keep long-term rates high. This combination creates an ideal environment for banks: increased margins, rising loan volumes and stronger profitability.
Despite the recent rise, banks remain cheap: 10 times expected earnings in Europe, 13 times in the United States, compared with historical averages of 11 and 15. They are trading at a discount of 66% to the European market and 56% to the US market. This upside potential is attracting investors looking for opportunities, especially in a context where other sectors are trading at much higher multiples.
The earnings outlook is solid: +9% in 2025 on both sides of the Atlantic. In Europe, the financial sector accounts for 37% of expected earnings, close to pre-crisis levels (40%). In the United States, it accounts for 19% of the S&P 500. This momentum is based on credit growth, AI-related productivity gains, sector consolidation and higher management fees. All of these factors should support profitability and shareholder distributions.
The correlation between the yield curve and bank profitability suggests a favourable trend. With monetary policies remaining accommodative and long-term rates supported by public deficits, the banking sector should remain well positioned. In addition, in the United States, the easing of banking regulations could further support the profitability of US banks. For investors, this is therefore a comeback that should not be overlooked, especially in a context where sector diversification is more necessary than ever.
MSCI, 17 November 2025
Author: Luke Flemmer, Head of Private Markets
Private markets have grown rapidly, but unlike public markets, they still lack a consistent classification standard. This makes it difficult to compare data across funds and strategies, understand exposures, or report performance in a consistent manner. The lack of a common framework creates friction in both directions: Limited Partners (LPs) must reconcile the heterogeneous reports of several General Partners (GPs), while GPs must adapt to the different data and reporting expectations of each LP. Institutional investors increasingly want a comprehensive view of their portfolios, applying consistent definitions of asset classes across public and private markets to better understand diversification and risk. This integration remains complex and time-consuming.
MSCI PACS addresses these gaps by introducing a standardised classification framework that brings order, comparability and consistency to private markets. It aligns GPs with the same language and structure used by their LPs, enabling both parties to communicate more effectively, streamline reporting and gain a clearer and more consistent understanding of their portfolios. Our goal is to make this data available to investors in the most comprehensive way possible. MSCI PACS is a global taxonomy created specifically for private assets. It aims to bring greater transparency and improve comparability in this area.
Indeed, the risk/return profiles of different asset classes vary greatly. Broadly speaking, infrastructure investments are the most consistent, which is not surprising given that they are long-term investments that generate stable cash flows. They are also investments that take place within a highly regulated framework. Overall, infrastructure meets the needs of long-term investors looking for regular income, such as pension funds. In contrast, private credit is subject to much greater fluctuations depending on market conditions and economic developments.
In between, we find buyout capital, which is certainly subject to fluctuations, but these are less pronounced than those of venture capital, which is subject to much more marked cycles.
Of course, it is not possible for private markets to set prices in real time as is the case for securities listed on stock markets. Establishing a benchmark for private assets requires processing very large amounts of data analysed over time. We provide large amounts of useful information for both General Partners, the entity in charge of managing an investment fund, and Limited Partners, passive investors. The next question is how to provide adequate benchmarks for each segment within private assets. For example, we can compare the MSCI Global Private Equity Closed-End Fund Index, which covers venture capital and private equity, with the MSCI World Small Cap Index.
For general partners, it is important to be able to open the box in order to assess exactly what is in the private assets in which they wish to invest. They want to understand in detail how management fees are structured and how alpha is generated. Managers who do not provide sufficient data to meet these needs will lose appeal compared to those who demonstrate greater transparency.
Note that the partnership with Moody's brings a highly complementary expertise. Moody's has a wide range of analytical tools that enable real-time credit risk analysis. MSCI has vast amounts of data on funds and loans.
Equities
Weekly performances after earnings releases:
Walmart (+2.5%), Home Depot (-5%), Nvidia (-4%)
Soitec (-38%), Osram (-25%), Valeo (-15%)
NB: Dell (-1.5%, MS u/w downgrade); Alphabet (+5%, Berkshire Hathaway $4bn participation); Roche (+10%)
Analysts: Richemont (Barclays ‘o/w’ target ₣192), Nestlé (GS ‘buy’ target ₣93), Vivendi (JPM ‘o/w’ target €2.90), Siemens Energy (HSBC, LBBW and DB ‘buy’ target €130)
Rates
US curve (2-10 years) steepening unchanged at 55bps
HY corp. spreads slightly higher (+5bps, US at 315bps, EU at 290bps)
Commodities
Oil price weaker (-3.5%) stronger USD and US-RU-UA peace talks
Gold slightly lower (-0.5%) due to a stronger USD
UK
Oct inflation slowed at +3.6% boosting chances of a Dec rate cut, post budget delivery (26th Nov)
Japan
Q3 GDP contracted by 1.8% the first decline in 6 quarters (US tariffs)
Crypto
BTC much lower (-12%) amplified by leveraged bets (Cryptos wiped out $1trn market value, total market cap at $2.8trn now)
Under the watch
30 year JGB yield (inflation is running high while BoJ rates are at 0.5%)
Nota Bene
YTD stock indices, top of the class EM at +24% and Nikkei at +22%
M. Wilson (MS well known bear) sees SP500 at $7800 by 2026 yearend
Amazon issued $12bn worth of bonds to finance its AI investments
CALENDAR
Q3 earnings releases:
US Dell, Analog Devices (25 Nov)
Macro releases: US Sep PPI (25 Nov), Sep PCE inflation (26 Nov)
Markets closed: US Thanksgiving (27 Nov)
WHAT ANALYSTS SAY
- Vanguard: Record inflows for ETFs, boosted by Bond demand
- ING: Banking on Banks, correlation between yield curve and bank profitability suggests a favourable trend
- MSCI: A new standard for comparing Private Markets performance
Vanguard, 17 November 2025
Author: Manon Duez, Senior Executive
While equity ETFs once again dominated subscriptions, at £28.6 billion, demand for bond ETFs accelerated sharply, reaching £17.6 billion – nearly triple the previous month's figure.
This movement took place in a favourable market environment, marked by an easing of trade tensions between the United States and China, strong corporate earnings in the United States and a further cut in Fed interest rates. Investors favoured exposure to the eurozone, which attracted £10.4 billion, an annual high.
Corporate and government bond ETFs also had their best months of 2025, with £7.1 billion and £4.8 billion in subscriptions respectively, while ultra-short-term ETFs continued their series of positive flows (+£3.0 billion).
Since January, ETFs domiciled in Europe have attracted $313.4 billion in net inflows, compared with $213.4 billion in the same period in 2024. Equity ETFs account for $236.9 billion and bond ETFs for $73.0 billion.
Core equity ETFs continued to attract significant net inflows, gaining an additional $15.7 billion in October. Since the beginning of the year, they have totalled $158.5 billion in net subscriptions. Sustainable equity ETFs recorded £5.3 billion in net inflows last month, while thematic ETFs added £3.2 billion. Sector and smart beta ETFs, on the other hand, saw net outflows of £515 million and £374 million, respectively.
US equity ETFs once again led the way, recording £7.4 billion in net inflows in October. This marks the fourth consecutive month of positive flows, following a more irregular trend in the first half of the year. Global equity ETFs and developed market ETFs attracted net inflows of $5.5 billion and $5.2 billion, respectively. ETFs focused on Germany and Europe excluding the United Kingdom, on the other hand, saw net outflows of $847 million and $512 million, respectively.
Corporate bond ETFs recorded £7.1 billion in net subscriptions in October, while government bond ETFs collected £4.8 billion. Notably, both categories have posted identical net flows of £18.4 billion since the beginning of the year. Ultra-short-term bond ETFs enjoyed another month of positive flows, adding £3.0 billion, bringing their cumulative total since January to £25.1 billion – the highest among bond ETF categories. Net outflows were also limited last month across all segments tracked.
Eurozone bond ETFs once again recorded the largest net inflows among bond products, with $10.4 billion collected in October. This marks ten consecutive months of positive inflows in 2025, for a cumulative total of $40.1 billion since the beginning of the year.
US and global bond ETFs also recorded net inflows last month, adding $3.1 billion and $2.8 billion respectively.
Conversely, some single-country bond ETFs experienced relatively modest net outflows.
ING, 17 November 2025
Author: Vincent Juvyns, Chief Investment Strategist
After years of gloom, banks are making a remarkable comeback on the stock market. Their exceptional performance can be explained by three key factors: the steepening of the yield curve, still attractive valuations and solid earnings prospects. This favourable cocktail has put the financial sector back at the heart of asset allocations, alongside technology stocks boosted by the rise of artificial intelligence.
In Europe, the Stoxx 600 banking index has jumped more than 53% since the beginning of the year, reaching levels not seen since 2008. To find a similar performance, we have to go back to 2009 (+47%). This rally, which began in October 2022, brings the cumulative gain to 179%, well above the European (+49%) and US (+57.5% in euros) markets over the same period.
In the United States, growth has been more moderate this year (+22% in dollars), but prices are flirting with historic highs. By way of comparison, the US technology sector is up +23.5% and the ‘Magnificent Seven’ are up +20% this year. In other words, banks have once again become a major player in the stock market.This outperformance is not insignificant: in Europe, the banking sector is the biggest contributor to the market's rise (+13% for the Stoxx Europe 600), ahead of insurers (+20%). In the United States, despite the negative impact of exchange rates (the dollar has fallen against the euro), banks are performing at unprecedented levels. This strong comeback marks the end of a decade of underperformance and confirms that the sector has regained solid fundamentals.
The key lies in the steepening of yield curves. After a period of inversion in 2023, the spread between long- and short-term rates has widened significantly (1.3% in Europe, 1.2% in the United States). Long-term rates are supported by massive public spending and record budget deficits, while short-term rates are falling as a result of accommodative monetary policies. This configuration favours lending, supports margins and fuels dividends, which justifies the sector's re-rating. Investors anticipate that the Federal Reserve will continue to cut short-term rates, while the ECB will maintain an accommodative policy to support a fragile economy. At the same time, massive public spending plans – €500 billion in Germany for defence and infrastructure, and tax reform in the United States that will increase the deficit by $2.4 trillion over 10 years – should keep long-term rates high. This combination creates an ideal environment for banks: increased margins, rising loan volumes and stronger profitability.
Despite the recent rise, banks remain cheap: 10 times expected earnings in Europe, 13 times in the United States, compared with historical averages of 11 and 15. They are trading at a discount of 66% to the European market and 56% to the US market. This upside potential is attracting investors looking for opportunities, especially in a context where other sectors are trading at much higher multiples.
The earnings outlook is solid: +9% in 2025 on both sides of the Atlantic. In Europe, the financial sector accounts for 37% of expected earnings, close to pre-crisis levels (40%). In the United States, it accounts for 19% of the S&P 500. This momentum is based on credit growth, AI-related productivity gains, sector consolidation and higher management fees. All of these factors should support profitability and shareholder distributions.
The correlation between the yield curve and bank profitability suggests a favourable trend. With monetary policies remaining accommodative and long-term rates supported by public deficits, the banking sector should remain well positioned. In addition, in the United States, the easing of banking regulations could further support the profitability of US banks. For investors, this is therefore a comeback that should not be overlooked, especially in a context where sector diversification is more necessary than ever.
MSCI, 17 November 2025
Author: Luke Flemmer, Head of Private Markets
Private markets have grown rapidly, but unlike public markets, they still lack a consistent classification standard. This makes it difficult to compare data across funds and strategies, understand exposures, or report performance in a consistent manner. The lack of a common framework creates friction in both directions: Limited Partners (LPs) must reconcile the heterogeneous reports of several General Partners (GPs), while GPs must adapt to the different data and reporting expectations of each LP. Institutional investors increasingly want a comprehensive view of their portfolios, applying consistent definitions of asset classes across public and private markets to better understand diversification and risk. This integration remains complex and time-consuming.
MSCI PACS addresses these gaps by introducing a standardised classification framework that brings order, comparability and consistency to private markets. It aligns GPs with the same language and structure used by their LPs, enabling both parties to communicate more effectively, streamline reporting and gain a clearer and more consistent understanding of their portfolios. Our goal is to make this data available to investors in the most comprehensive way possible. MSCI PACS is a global taxonomy created specifically for private assets. It aims to bring greater transparency and improve comparability in this area.
Indeed, the risk/return profiles of different asset classes vary greatly. Broadly speaking, infrastructure investments are the most consistent, which is not surprising given that they are long-term investments that generate stable cash flows. They are also investments that take place within a highly regulated framework. Overall, infrastructure meets the needs of long-term investors looking for regular income, such as pension funds. In contrast, private credit is subject to much greater fluctuations depending on market conditions and economic developments.
In between, we find buyout capital, which is certainly subject to fluctuations, but these are less pronounced than those of venture capital, which is subject to much more marked cycles.
Of course, it is not possible for private markets to set prices in real time as is the case for securities listed on stock markets. Establishing a benchmark for private assets requires processing very large amounts of data analysed over time. We provide large amounts of useful information for both General Partners, the entity in charge of managing an investment fund, and Limited Partners, passive investors. The next question is how to provide adequate benchmarks for each segment within private assets. For example, we can compare the MSCI Global Private Equity Closed-End Fund Index, which covers venture capital and private equity, with the MSCI World Small Cap Index.
For general partners, it is important to be able to open the box in order to assess exactly what is in the private assets in which they wish to invest. They want to understand in detail how management fees are structured and how alpha is generated. Managers who do not provide sufficient data to meet these needs will lose appeal compared to those who demonstrate greater transparency.
Note that the partnership with Moody's brings a highly complementary expertise. Moody's has a wide range of analytical tools that enable real-time credit risk analysis. MSCI has vast amounts of data on funds and loans.
Contacts
Main office
1-5, № 53, 12 Charents Str., Yerevan, 0025
+374 43 00-43-82
Broker
broker@unibankinvest.am
research@unibankinvest.am
Disclaimer
The information presented in the document contains a general overview of the products and services offered by Unibank OJSC (registered trademark – Unibank Invest, hereinafter referred to as the Bank).
The information is intended solely for the attention of the persons to whom it is addressed. Further dissemination of this information is allowed only with the prior consent of the Bank.
The information is only indicative, is not exhaustive and is provided solely for discussion purposes. The information should not be regarded as a public offer, request or invitation to purchase or sell any securities, financial instruments or services. The Bank reserves the right to make a final decision on the provision of these products and/or services to a specific customer, including refusing to provide products and/or services if such activities would be contrary to applicable law.
No guarantees in direct or indirect form, including those stipulated by law, are provided in connection with the specified information and materials. The information presented above cannot be considered as a recommendation for investing funds, as well as guarantees or promises of future profitability of investments.